Solar Insights update
Driving down the cost of new renewable energy is a big part of why ARENA exists – hence, the importance of understanding the cost components of applications to our recent large-scale solar funding round.
Applicants told us how much it would cost to build their facilities – the capital cost of their plant (the other half of the ‘costs’ story is the operational cost, which we’ll examine in a follow-up post).
Given the relative infancy of the large-scale solar industry in Australia, estimations of capital costs are a valuable insight into the rapid changes flowing through the Australian large-scale solar industry. We’ve discovered some fascinating insights into some flagship projects in this industry, which we’re sharing below and as a downloadable dataset at the end of this post, as part of our knowledge sharing mandate.
A recent article (subscription required) in the Australian Financial Review examines capital costs, with analysts stating that:
“The costs (of the latest large-scale solar farms) are half of what the the capital intensity was of the ones that are on stream and were built over 2015 and 2016. It’s a huge step forward for the industry and for the future of solar in Australia.”
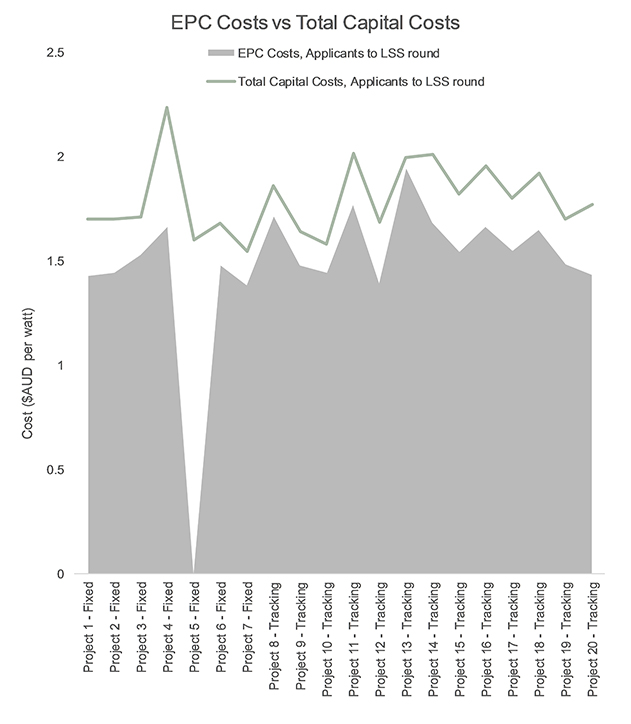
It’s an important piece of data – how much do you need to pay to build new large-scale solar, and what does that tell us about the rate of growth of the industry? Below, we’ve presented a chart showing the total capital cost, per DC watt, for each of the twenty final-stage applicants (twelve of these were chosen as winners), with project names anonymised:

The average cost of building these new large-scale solar farms is $1.8 cents per DC watt, with an average of $1.74 for fixed-axis projects and an average of 1.83 cents per DC watt for facilities that feature panels that track the sun’s movement. This isn’t surprising – more movements parts are likely to be more expensive than inanimate frames.
Digging further into this dataset, the chart below shows capital costs split up by state, with states featuring two or less projects (WA, Vic and SA) summarised as ‘OTHER’, to preserve anonymity:

Though there isn’t much drama in the averages between the states, the range tells a different story – the minimum and maximum capital costs from the 4 projects in WA, Vic and QLD reflect the varied conditions in the geographically disparate states. Queensland and New South Wales, both with further-advanced large-scale solar industries and 8 projects each, sit within tighter parameters.
There’s an alternative and somewhat flawed way of examining this vital piece of information – using the costs attributed to ‘Engineering, Procurement and Construction’ (EPC) contracts. We ultimately decided against this, as some of the project applicants can perform these functions themselves, and as such, the costs of building the large-scale solar farms can be ‘hidden’. To illustrate this underestimation effect, a comparison of the two:
First Solar published a report using the National Renewable Energy Laboratory (NREL) ‘Open PV’ data set, and other solar studies from the Lawrence Berkeley National Laboratory (LBNL). They found that in May 2014, large-scale solar projects in the US were seeing an average of $3.17 $USD per DC watt ($4.23 AUD). The analytics firm quoted in the Financial Review article above estimates $1.79 per DC watt and $1.57 per DC watt for two different Australian solar farms – which fall in the range of our data. Though the US and Australian large-scale solar industries are very different, this gives us an idea of how costs might fall when the Australian large-scale solar market reaches the maturity seen in the US.
As we’ve seen in previous knowledge-sharing posts on our blog, costs are going down for other parts of the process of building big solar, such as connecting to the grid. The fundamental nature of paying for the machine that generates clean, sustainable energy remains an important watermark for changes that flow through a nascent, growing industry.
You can download the anonymised data set used to generate these charts here (XLSX 10KB)
LIKE THIS STORY? SIGN UP TO OUR NEWSLETTER
ARENA