Solar Insights
In our previous post, we discussed the costs of building new large-scale solar farms – specifically, we found that the costs tend to be around $1.8 per DC watt, when looking at applicant to our large-scale solar funding round.

Though capital costs are a big part of story, they’re not the whole picture – over the lifetime of one of these plants, operators need to deal with the costs of operation, including maintenance, insurance, operations, administration, land and many other factors.
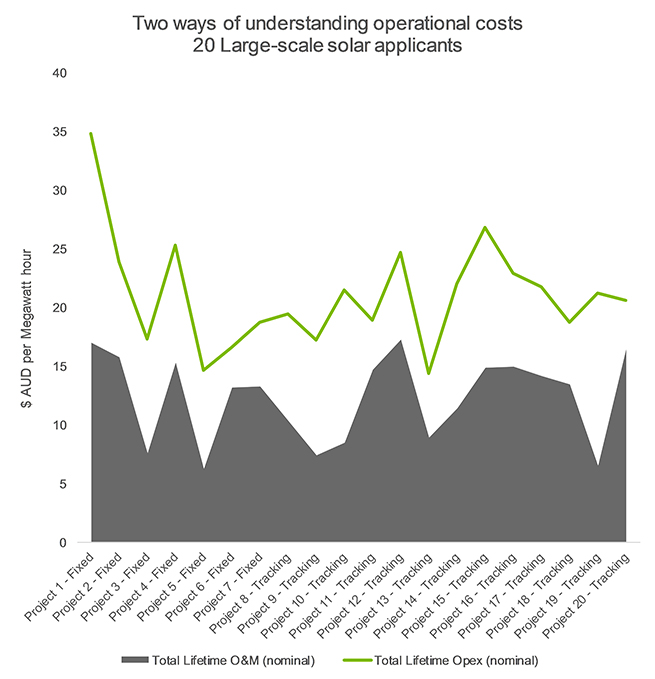
We captured the predicted costs of these within submissions to our large-scale solar funding round, and normalised them per megawatt hour of output (as opposed to watt of capacity for capital costs) for twenty final-stage applicants to the large-scale solar funding round (twelve were chosen as winners). You can download the data sets at the end of this blog post.
The chart belows shows ‘total lifetime opex’, which is all operational expenditure, and ‘Total lifetime O&M’, which only looks at operations and maintenance costs, and excludes factors like insurance. Note that the project listing is randomised. The average across all 20 projects was 21 $/MWh – with little difference between fixed and tracking, which might seem surprising – though it’s worth remembering that the technology type is one factor among many.

Putting our finger on the pulse of how this industry grows in its early years can be a tricky process – the chart above illustrates that using the wrong data point can underestimate the forecasted costs of running a large-scale solar farm.
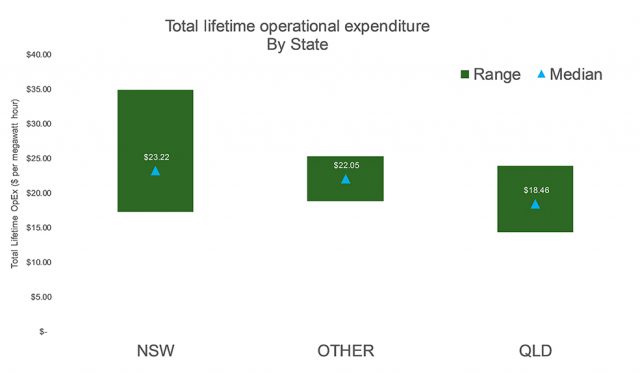
As with our previous post, interrogating this data set by state gives us some greater insights. States featuring two or less projects (WA, Vic and Qld) summarised as ‘OTHER’, to preserve anonymity:

Queensland sees lower operational costs for large-scale solar plants than New South Wales – though New South Wales’ range goes low. The ‘other’ states are considered more predictable, with less variation between the applicants. Forecasting these data points isn’t an easy process, and the variation above illustrates how conditions in each state affect our estimates of future costs. Australia has unique conditions, and only a few operational large-scale solar plant that have been operational for a few years or less.
Some older data from the Lawrence Berkeley National Laboratory, produced in 2012, suggest costs of around $13 AUD to $20 AUD per megawatt hour, which roughly matches our stated average of $21 AUD per megawatt hour – but as we stated in our previous posts, conditions are unique in Australia, and we don’t doubt we’ll see the emergence of interesting and novel patterns in the data underpinning the operations of large-scale solar in Australia.
As part of the process of helping innovation and cost reductions in this nascent industry, ARENA will be sharing knowledge and data regarding actual operation throughout the lifetime of the facilities. Through sharing knowledge related to all stages of developing large-scale solar, we’ll see an easing of the risks and variability that emerges in any new industry emerging at speed in a country largely dominated by traditional forms of generation.
Download the anonymised data set used to generate these charts (XLSX 10KB).
—-
By Matthew Walden and Ketan Joshi
LIKE THIS STORY? SIGN UP TO OUR NEWSLETTER

ARENA